Using the Server Status Widget
You can use the Server Status widget to monitor the status of Mac OS X Server either
on the server itself or from another computer with Mac OS X Server or Mac OS X.
To use the Server Status widget:
1
Open Dashboard and look for the Server Status widget.
You can open Dashboard by clicking its icon in the Dock, or by pressing its keyboard
shortcut, which is usually the F4 key or the F12 key.
If you don’t see the Server Status widget in Dashboard, click Dashboard’s Open (+)
button and then click or drag the Server Status widget from the widget bar.
2
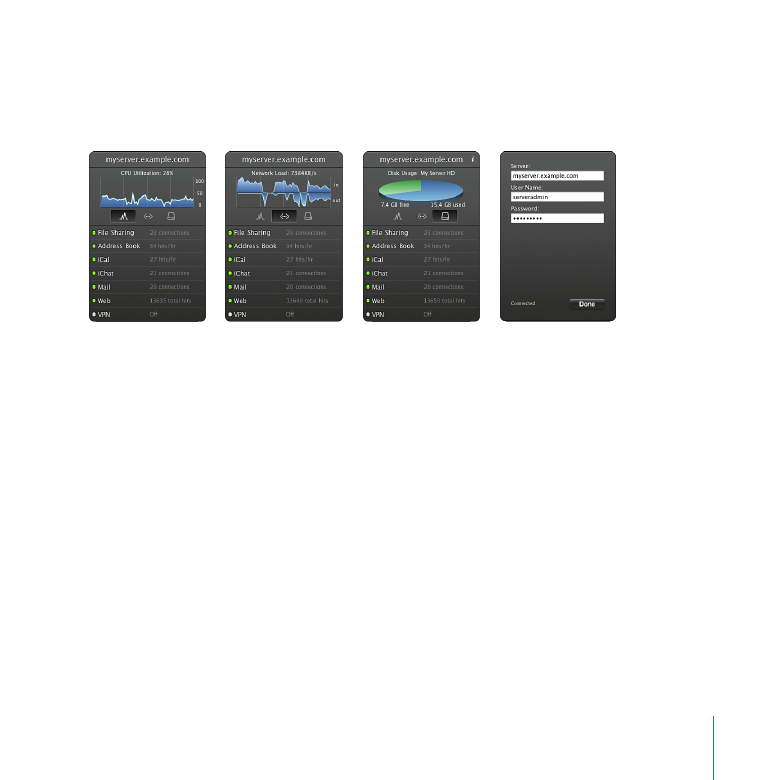
If you see the Server, User Name, and Password fields, enter the server’s DNS name or IP
address followed by an administrator name and password, and then click Done.
3
When the Server Status widget is connected to a server, it displays a graph and other
status information about the server and its services.
Monitor processor utilization, network load, or disk usage by clicking an icon below
Â
the graph.

76
Chapter 5
Managing Your Server
Change the processor or network graph’s time period to one hour, day, or week by
Â
clicking the graph.
If your server has more than one disk, view the status of each disk in turn by clicking
Â
the disk usage graph.
Check the status indicator and activity statistics for the listed services. A green
Â
indicator means the service is running.
Connect to a different server by moving the mouse to the upper left corner of the
Â
widget and clicking the small Info (i) button.
You can open another Server Status widget to see more than one aspect of a server’s
status at once, or to monitor another server on the network.
The Server Status widget works with Mac OS X Server v10.6 Snow Leopard and
Mac OS X v10.6 Snow Leopard.
For information about widgets and Dashboard, switch to the Finder and then use the
Help menu.
You can also see graphs of server activity using Server Preferences. For information,
see “Monitoring Server Graphs” on page 169.
77
Chapter 5
Managing Your Server